What is ATmatix?
If you are trading stocks, you can leverage Technical Analysis to determine the exact moment of purchase or disposal of shares, or other financial instruments. ATmatix will make it easy for you - it automatically detects and tracks the most popular chart patterns for the Warsaw Stock Exchange (Poland), such as double bottoms and tops, triangles, wedges, channels, flags, pennants and more, as well as trend lines and levels of support and resistance. If you don't know if a stock price is going to rise or decline, use chart patterns and their statistics.
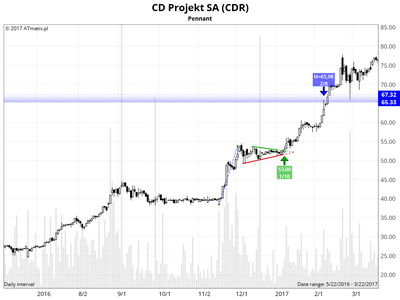
CD Projekt - Pennant chart pattern (profit 47%*)
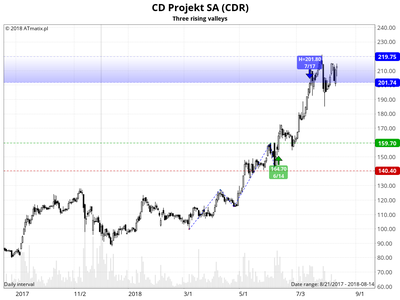
CD Projekt - Three rising valleys pattern (profit 38%*)
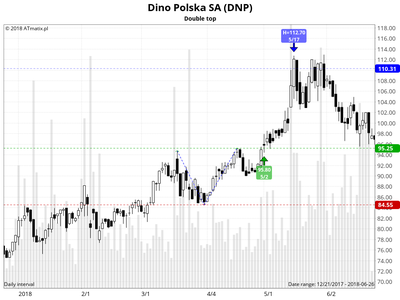
Dino Polska - Invalidation of the double top pattern (profit 18%*)
* - from the breakout price to the maximum, assuming a perfect trade and excluding any transaction fees.
Blue lines on charts denote the price targets automatically set by ATmatix algorithms after a breakout.
Why is ATmatix beneficial?
Automated price chart patterns recognition
Automated trend lines detection
Automated support and resistance levels
Breakout and completion event alerts
E-mail notifications
Pattern performance statistics
WSE main market stocks and indices
15 days of full access for free
- ATmatix automatically finds classic technical analysis chart patterns - see our patterns table and charts. Our analysis is based on end-of-day data and updated every day shortly after the WSE trading session ends.
- Our algorithms determine breakout levels (support and resistance levels within a given pattern), as well as calculate the target range of post-breakout price movement with its estimated probability. We automatically predict those ranges based on our statistics gathered from historical WSE data as well as using classic measure rules. The highest value is attached to analyzing the trend of the volume during pattern creation and the volume of pattern breakout.
- All major price levels, as well as peaks or valleys that limit the pattern, are shown in the chart. We are automatically assessing the statistical probability of achieving price target based on the pattern post-breakout performance in the past.
- We will let you know when the price gets close to the breakout level, inform about the breakouts (based on the closing prices at the end of the session), or about reaching the pre-determined target price range - we automatically send email notifications.
Go to the pattern search page.
Chart patterns
Sign up for a free PREMIUM account.
Register
What is the cost?
Currently, registering a new account gives you full access (PREMIUM account) for 15 days for FREE and without any commitment (no credit card required). The prolongation of a PREMIUM subscription is voluntary and you will be able to cancel at any time.
What's included?
- PREMIUM account gives you access to all the pattern data found for stocks, indices and FW20 futures listed on the WSE (the main market). You will gain access to the historical patterns statistics, information on the volume trend during pattern creation and a breakout day volume. If you wish, you will also receive periodic email notifications of the most important events we have detected.
- Users without a PREMIUM subscription have access only to the selected stocks within the WIG20 index, as well as to the selected WSE indices.
- All registered users can add their favorite assets to their Watch List.
For more information, see the Help section, and our Blog.